News

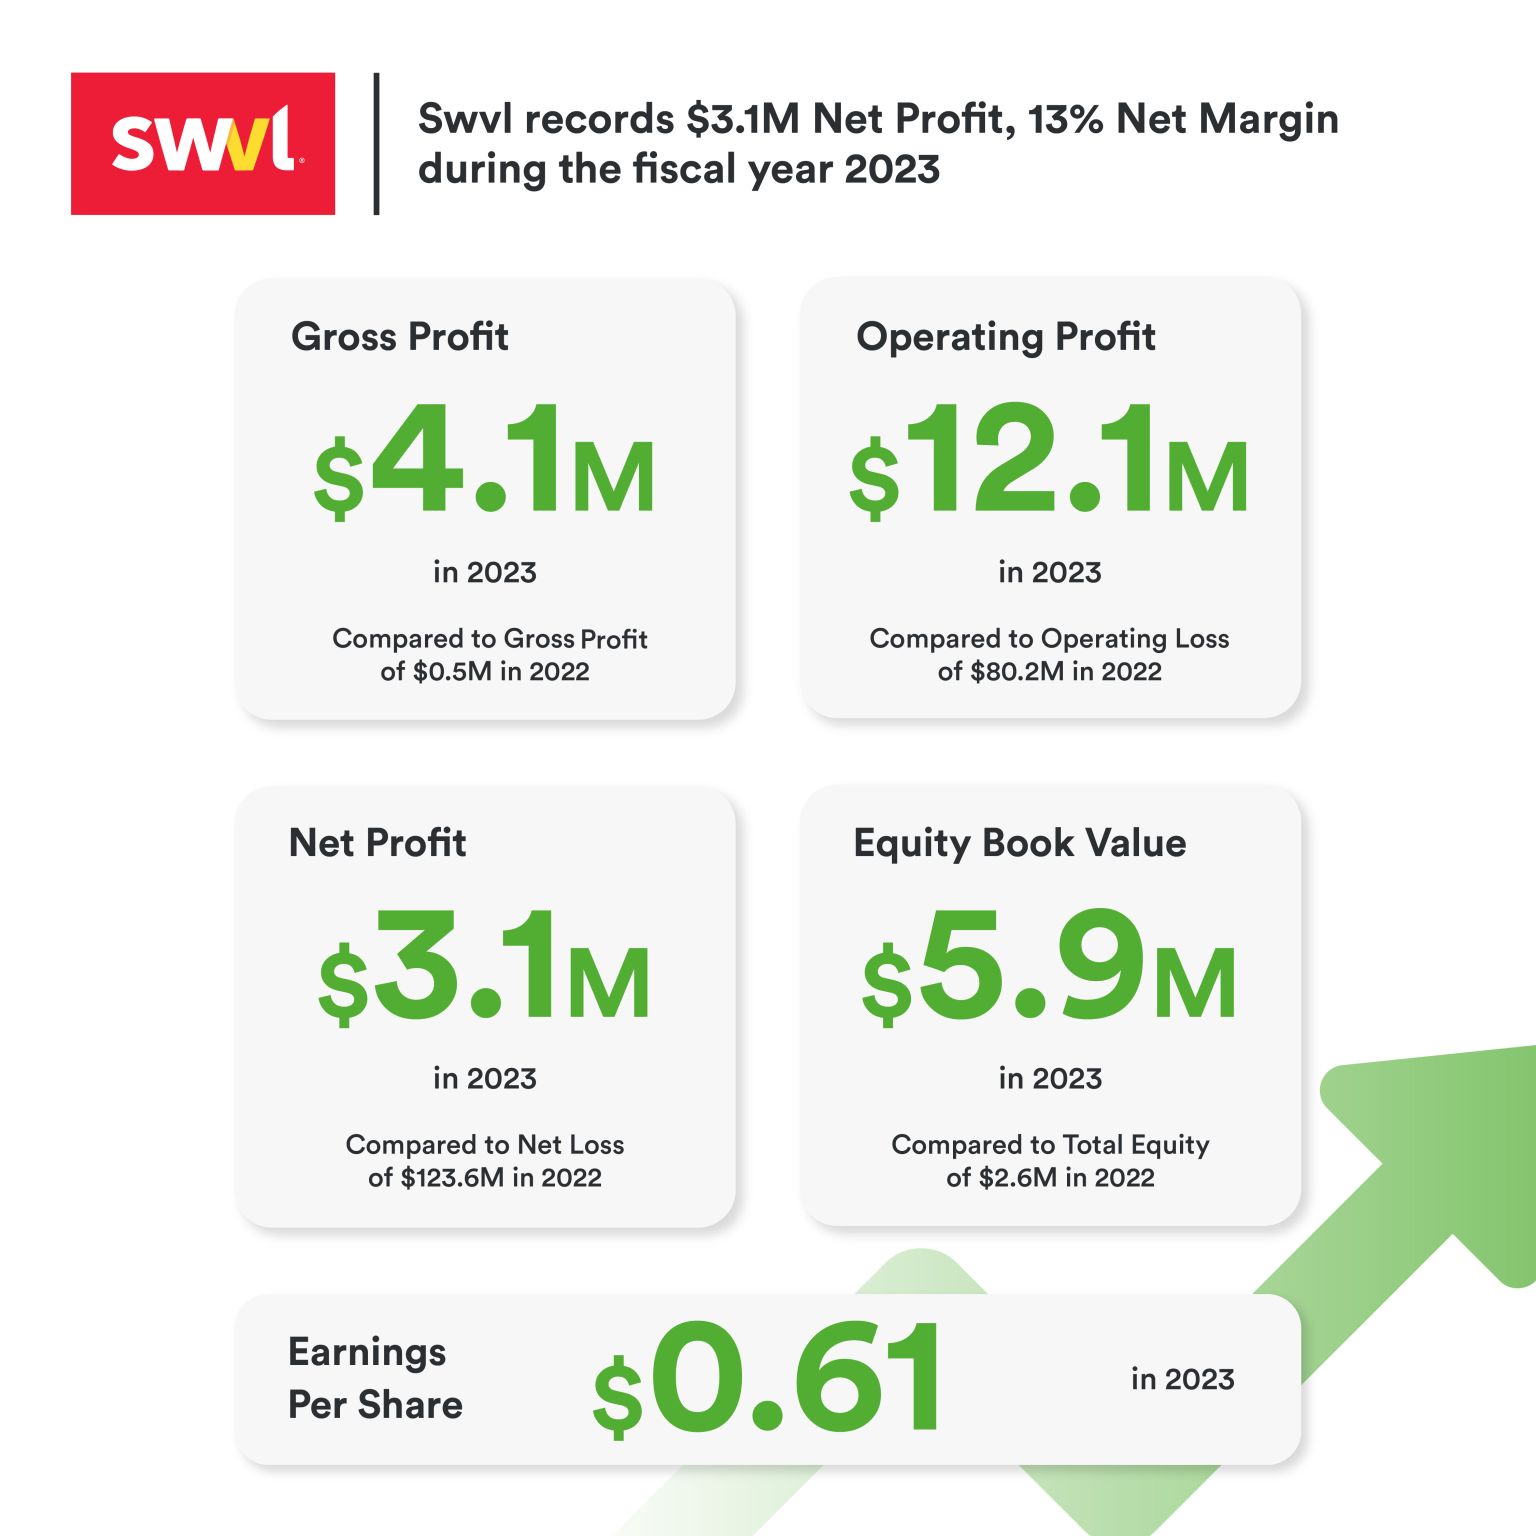
Swvl Records $3.1m Net Profit, 13% Net Margin, and an Eightfold Growth in Gross Profit

8x Gross Profit growth year on year to $4.1 million Achieved cash flow positivity, with self-funded growth

Profitable growth drove earnings per share from continuing operations to $0.61

Strong balance sheet with no debt and more than doubled the positive equity value compared to 2022

DUBAI, United Arab Emirates, April 30, 2024 (GLOBE NEWSWIRE) — Swvl Holdings Corp (“Swvl” or the “Company”) (Nasdaq: SWVL), a technology provider for enterprise and government mobility solutions with a global footprint, announces a significant achievement in its financial performance for the fiscal year 2023. The Company has successfully delivered positive net profit and cashflow for the full year.

Continuing the positive momentum established in the initial half of the fiscal year, Swvl completed the path to profitability program initiated in 2022. The Company is committed to boosting profitability further while concurrently resuming strategic expansions into high-revenue markets.

Financial Highlights for Fiscal Year Ended December 31, 2023:


Net Profit: $3.1 million, a turnaround from a net loss of $123.6 million in 2022

Gross Profit: Increased more than eightfold to $4.1 million from $0.5 million in 2022

Operating Profit: $12.1 million, compared to an operating loss of $80.2 million in 2022

Earnings Per Share: Profitable growth boosted basic earnings per share from continuing operations to $0.61

Balance Sheet Strength: Ended the year with a strong balance sheet, no debt, and an equity value more than double that of the prior year, at $5.9 million

Equity Book Value: Total equity book value of $5.9 million as of December 31, 2023, compared to $2.6 million as of December 31, 2022


This result marks Swvl’s swift transition to profitability, highlighting a focus on financial stability and operational efficiency, and the effective implementation of profitability strategies during the fiscal year. The Company’s continuous efforts to maintain positive cash flow and profitability support its upcoming planned expansion into high-revenue markets.

Mostafa Kandil, CEO of Swvl, stated, “In 2023, our team demonstrated exceptional skill and dedication, achieving profitability. As we advance, our commitment to innovation will be marked by the launch of a wide range of products slated for the upcoming year and for our new potential markets. Additionally, in the meantime, we are expanding our strategic partnerships into more Gulf Cooperation Council (GCC) countries. Our focus today remains towards improving profitability while resuming our high paced growth.”

Post December 31, 2023, Swvl continued to make strides to further solidify its financial position, focusing on increasing margins and maintaining efficient operations. Swvl remains focused on sustaining this positive momentum, further strengthening its financial position, and continuing to deliver enhanced value to its shareholders and stakeholders in the future of the mobility landscape.

For detailed financial information, please see Appendix A for the consolidated financial statements. This press release, along with complete financial statements and the investor presentation, can be found in the Investor Relations section of Swvl’s website at https://www.swvl.com

About Swvl

Swvl is a global technology provider for enterprise and government mobility solutions. The company’s platform provides alternatives to public transportation for individuals who cannot access or afford private options. Every day, Swvl’s parallel mass transit systems empower individuals to go where they want, when they want – making mobility safer, more efficient, accessible, and environmentally friendly. Customers can book their rides on an easy-to-use proprietary app with varied payment options and access to high-quality private buses and vans.

For additional information about Swvl, please visit www.Swvl.com.

Forward Looking Statements

This press release contains “forward-looking statements” relating to future events. Forward-looking statements generally are accompanied by words such as “believe,” “may,” “will,” “estimate,” “continue,” “anticipate,” “intend,” “expect,” “should,” “would,” “plan,” “predict,” “potential,” “seem,” “seek,”

“future,” “outlook” and similar expressions that predict or indicate future events or trends or that are not statements of historical matters. These forward-looking statements include, but are not limited to, statements regarding future events and other statements that are not historical facts. For example, Swvl is using forward looking statements when it discusses its commitment to boosting profitability further while concurrently resuming strategic expansions into high-revenue markets, its intention to launch of a wide range of products slated for the upcoming year, its intention to expand strategic partnerships into more GCC countries, and that its focus remains towards improving profitability while resuming its high paced growth. These statements are based on the current expectations of Swvl’s management and are not predictions of actual performance. These forward-looking


statements are provided for illustrative purposes only and are not intended to serve as, and must not be relied on, by any investor as a guarantee, an assurance, a prediction or a definitive statement of fact or probability. Actual events and circumstances are difficult or impossible to predict and will differ from assumptions. Many actual events and circumstances are beyond the control of Swvl. These statements are subject to a number of risks and uncertainties regarding Swvl’s business, and actual results may differ materially. In addition, forward-looking statements provide Swvl’s expectations, plans or forecasts of future events and views as of the date of this communication. Swvl anticipates that subsequent events and developments could cause Swvl’s assessments and projections to change. However, while Swvl may elect to update these forward-looking statements in the future, Swvl specifically disclaims any obligation to do so. These forward-looking statements should not be relied upon as representing Swvl’s assessments as of any date subsequent to the date of this communication. Accordingly, undue reliance should not be placed upon any forward-looking statements. Except as otherwise required by law, Swvl undertakes no obligation to publicly release any revisions to these forward-looking statements to reflect events or circumstances after the date hereof or to reflect the occurrence of unanticipated events. More detailed information about the risks and uncertainties affecting the Company is contained under the heading “Risk Factors” in the Company’s annual report on Form 20-F for the fiscal year ended December 31, 2023 filed with the U.S. Securities and Exchange Commission (the “SEC”), which is available on the SEC’s website, www.sec.gov, and in subsequent SEC filings.


Contact Investor.relations@Swvl.com  
 

Consolidated statement of financial position As of 31 December 2023

(All amounts are shown in USD unless otherwise stated)


2023


2022

ASSETS    
Non-current assets    
Property and equipment 751,693 1,270,838
Intangible assets 225,776 10,534,278
Right-of-use assets 484,362 815,646
Sublease receivables 553,029
Deferred tax assets 9,468,808 18,708,988
  10,930,639 31,882,779
 

Current assets

   
Trade and other receivables 5,327,877 14,815,432
Prepaid expenses and other current assets 2,142,194 3,298,377
Sublease receivables 571,022 648,523
Cash and cash equivalents 2,922,755 1,538,347
  10,963,848 20,300,679
Assets classified as held for sale 1,261 5,279,098
Total assets 21,895,748 57,462,556
 

EQUITY AND LIABILITIES

   
EQUITY    
Share capital 16,979 13,903
Share premium 347,295,152 343,435,529
Employee share scheme reserve 507,677 773,666
Foreign currency translation reserve (11,466,066) (4,347,257)
Reserve of disposal groups classified as held for sale 2,106,737 (492,474)
Accumulated losses (329,506,304) (332,562,780)
Equity attributable to equity holders of the Parent Company 8,954,175 6,820,587
 

Non-controlling interests


(3,039,317)


(4,191,394)

Total equity 5,914,858 2,629,193
 

LIABILITIES

   
Non-current liabilities    
Provision for employees’ end of service benefits 267,751
Derivative warrant liabilities 106,420 1,317,091
Deferred purchase price 194,093
Accounts payable, accruals and other payables 83,961
Lease liabilities 1,021,716 1,592,111
  1,212,097 3,371,046
 

Current liabilities


Deferred purchase price   1,207,682 7,425,488
Accounts payable, accruals and other payables   7,829,837 33,418,502
Current tax liabilities   627,068 1,027,404
Due to related party   131,523
Lease liabilities   640,695 751,015
    10,436,805 42,622,409
Liabilities directly associated with assets classified as held for sale   4,331,988 8,839,908
Total liabilities   15,980,890 54,833,363
Total equity and liabilities   21,895,748 57,462,556


Consolidated statement of comprehensive loss – For the year ended 31 December 2023

(All amounts are shown in USD unless otherwise stated)


2023


2022


2021

Continuing operations      
Revenue 22,852,263 44,099,610 25,563,945
Cost of sales (18,741,277) (43,581,963) (31,349,979)
Gross income/(loss) 4,110,986 517,647 (5,786,034)
General and administrative expenses (10,226,561) (62,918,437) (69,029,507)
Selling and marketing expenses (93,431) (17,520,448) (12,190,989)
Provision for expected credit losses (535,340) (873,442) (1,101,614)
Other income/(expenses), net 18,834,177 548,823 (807)
Operating profit / (loss) 12,089,831 (80,245,857) (88,108,951)
Finance income 97,553 209,434 126,449
Loss on disposal of subsidiaries (8,285,250)
Change in fair value of financial liabilities 1,210,671 109,720,648 (44,330,400)
Change in fair value of deferred purchase price 727,134 31,844,346
Change in fair value of employee share compensation schemes (1,636,738) 36,155,857
Recapitalization cost (139,609,424)
Impairment of financial assets (10,000,880)
Impairment of assets (46,381,441)
Finance cost (129,355) (3,666,643) (1,494,693)
Profit / (loss) before tax from continuing operations 4,073,846 (101,973,960) (133,807,595)
 

Income tax benefit


41,305


3,225,251


4,718,036

Profit / (loss) for the year from continuing operations 4,115,151 (98,748,709) (129,089,559)
 

Discontinued operations

     
Loss for the year from discontinued operations (1,058,675) (24,830,739) (12,399,838)
Profit / (loss) for the year 3,056,476 (123,579,448) (141,489,397)
 

Attributable to:

     
Equity holders of the Parent Company 3,056,476 (116,496,525) (141,416,132)
Non-controlling interests (7,082,923) (73,265)
  3,056,476 (123,579,448) (141,489,397)
 

Profit / (loss) per share attributable to equity holders of the Parent Company

     
Basic 0.45 (18.28) (20.92)
Diluted 0.28 (18.28) (20.92)
Profit / (loss) per share attributable to equity holders of the Parent Company for continuing operations      
Basic 0.61 (14.61) (19.10)
Diluted 0.37 (14.61) (19.10)
Other comprehensive income      
Items that may be reclassified subsequently to profit or loss:      


Exchange differences on translation of foreign operations, net of tax (5,299,295) (5,290,594) (409,511)
Total comprehensive loss for the year (2,242,819) (128,870,042) (141,898,908)
 

Attributable to:

Equity holders of the Parent Company


(2,242,819)


(121,787,119)


(141,825,643)

Non-controlling interests (7,082,923) (73,265)
  (2,242,819) (128,870,042) (141,898,908)


Consolidated statement of cash flows – For the year ended 31 December 2023

(All amounts are shown in USD unless otherwise stated)


2023


2022


2021


Profit / (loss) before tax from continued operations


4,073,846


(101,973,960)


(133,807,595)

Loss before tax from discontinued operations (1,058,675) (24,830,739) (12,399,838)
Profit / (loss) for the year before tax 3,015,171 (126,804,699) (146,207,433)
Adjustments to reconcile profit before tax to net cash flows:

Depreciation of property and equipment


356,288


604,304


182,402

Depreciation of right-of-use assets 364,116 1,216,495 541,218
Amortization of intangible assets 32,375 2,455,243 15,963
Provision for expected credit losses 535,340 873,442 1,327,104
Loss from sale of subsidiaries 8,285,250
Other income (18,834,177)
Gain on recognition of sublease receivable (87,026)
Sublease income (37,706) (8,340)
Provision for employees’ end of service benefits, net of reversals (171,447) 704,614
Finance cost 12,192 3,466,593 1,400,067
Listing costs 139,609,424
Change in fair value of deferred purchase price (727,134) (31,844,346)
Change in fair value of financial liabilities (1,210,671) (109,720,648) 44,330,400
Impairment of assets 46,381,441
Impairment of financial assets 10,000,880
Employee share-based payments charges / (reversals) 285,651 (36,155,857) 33,611,231
 

Changes in working capital:

(7,923,305) (100,184,541) (64,094,434)
Trade and other receivables 3,917,812 (11,489,377) (4,825,451)
Prepaid expenses and other current assets 995,660 (2,584,987) (868,620)
Accounts payable, accruals and other payables (6,471,125) (3,571,712) 8,259,002
Current tax liabilities 244,206 793,105 (635,821)
Due to related parties 131,523 36,091
  (9,105,229) (117,037,512) (62,129,233)
Payment of employees’ end of service benefits (635,314) (5,507)
Net cash flows used in operating activities (9,105,229) (117,672,826) (62,134,740)
 

Cash flows from an investing activity

Purchase of property and equipment


(17,237)


(817,586)


(319,471)

Proceeds from disposal of subsidiaries 8,400,000
Purchase of financial assets (10,000,880)
Payment for acquisition of subsidiary, net of cash acquired (743,292) (823,446)
Sublease rentals received 668,236 138,410
Purchase of financial assets (5,000,010)
Purchase of intangible assets (258,151) (1,666,934) (2,222)
Net cash flows generated from / (used in) investing activities 8,792,848 (8,089,412) (11,146,019)
 

Cash flows from financing activities

Proceeds from issuance of share capital


789,462


60,787,038


Proceeds from issuance of convertible notes 26,336,000 73,206,415
Proceed from PIPE subscription 39,664,000


Payments of external loan (134,830)
Repayment of loan from related party (195,270)
Finance cost paid (543,432) (2,653)
Finance lease liabilities paid, net of accretion (445,571) (850,773) (482,389)
Net cash flows generated from financing activities 343,891 125,062,733 72,721,373
 

Net increase / (decrease) in cash and cash equivalents


31,510


(699,505)


(559,386)

Cash and cash equivalents at the beginning of the year 2,696,276 9,529,723 10,348,732
Effects of exchange rate changes on cash and cash equivalents 196,230 (6,133,942) (259,623)
Cash and cash equivalents at the end of the year 2,924,016 2,696,276 9,529,723
Non-cash financing and investing activities:      
Settlement of deferred purchase price 5,377,829
Issuance of shares during the year 3,073,237 3,432,493
Fair value of shares earnouts (75,550,455)
Acquisitions of non-controlling interests (3,036,641)
Costs attributable to the issuance of shares 8,467,766
Conversion of convertible notes 145,952,505
Property and equipment additions through acquisition of business (586,452)
Intangible assets additions through acquisition of business (20,580,000)

Stay Updated

Stay connected and receive new news in your inbox.