Intelligent Mobility
Swvl powers businesses and individuals with end-to-end solutions to manage, track, and optimize transit and fleet operations for smoother, smarter journeys.
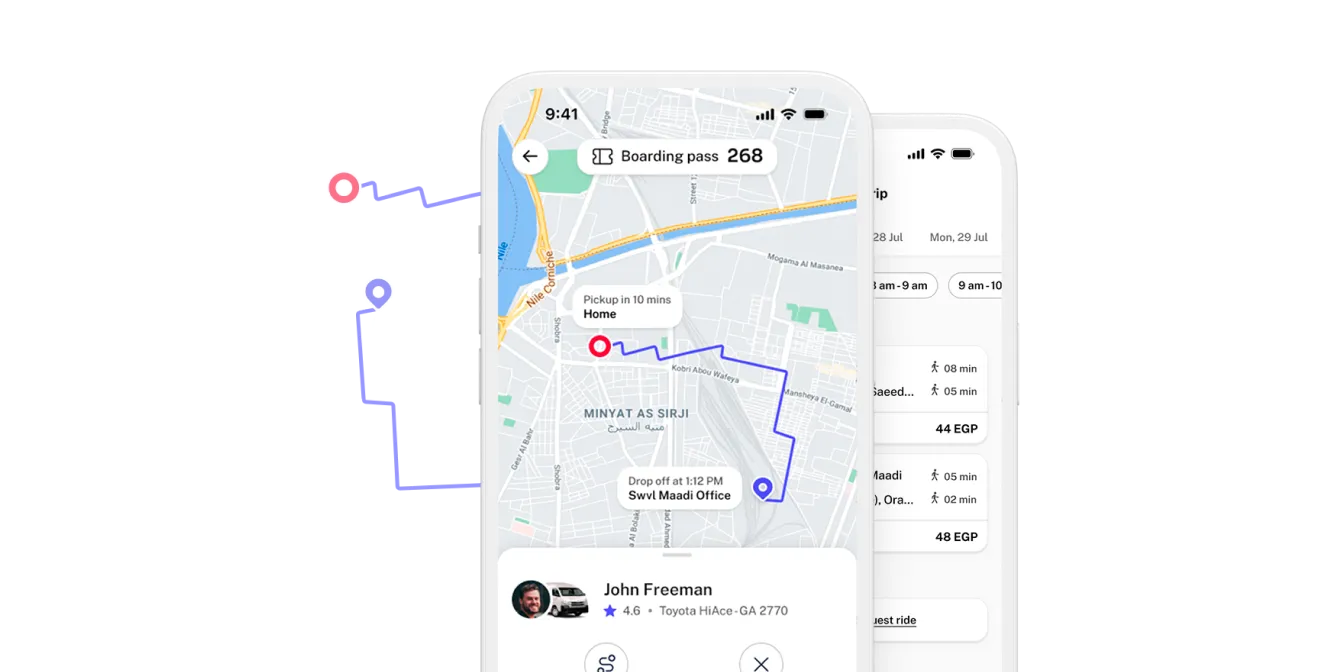
Responsive Transit
All journeys begin with a simple booking through Swvl’s Rider App. Whether heading to the office, university, factory, or construction site, Swvl provides rides for everyone. Riders can easily plan, book, and pay for their trip through Swvl’s Rider App.
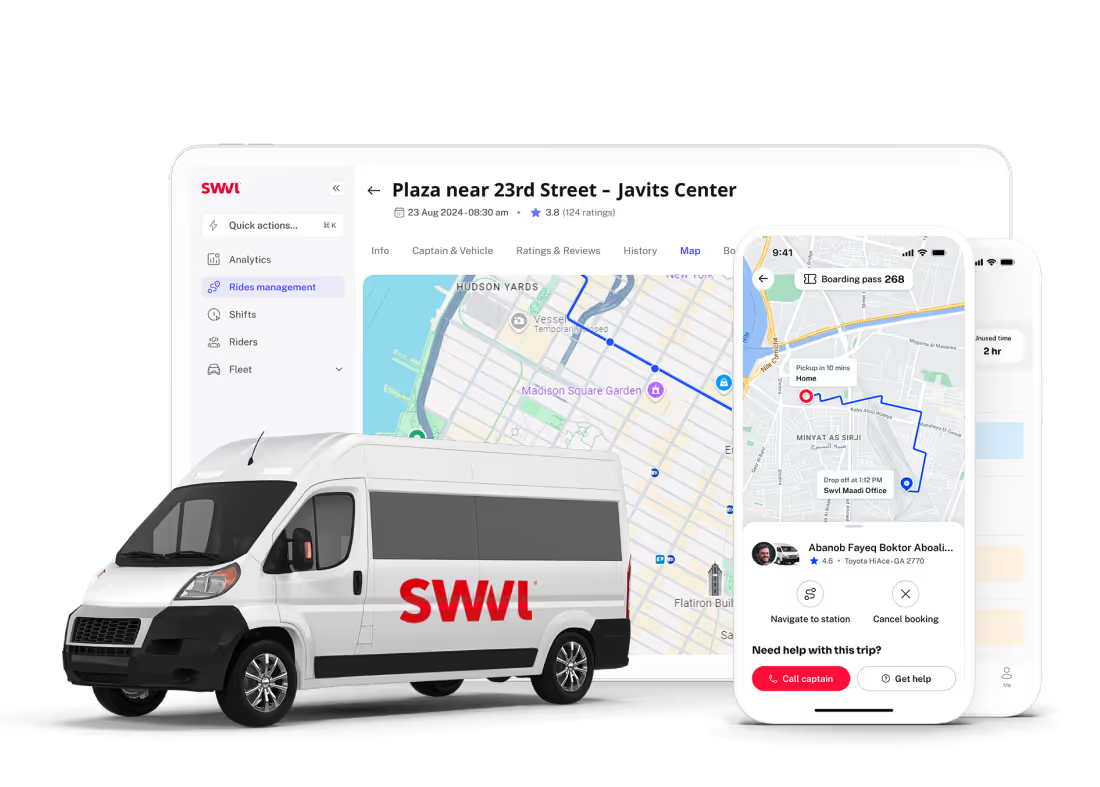
Next-Gen Solutions
Save time, cut costs, and lower your carbon footprint with Swvl. Our innovative platform – including the Rider App, Captain App, Admin Dashboard, and Partner Portal – reduces transportation costs and optimizes fleet operations.
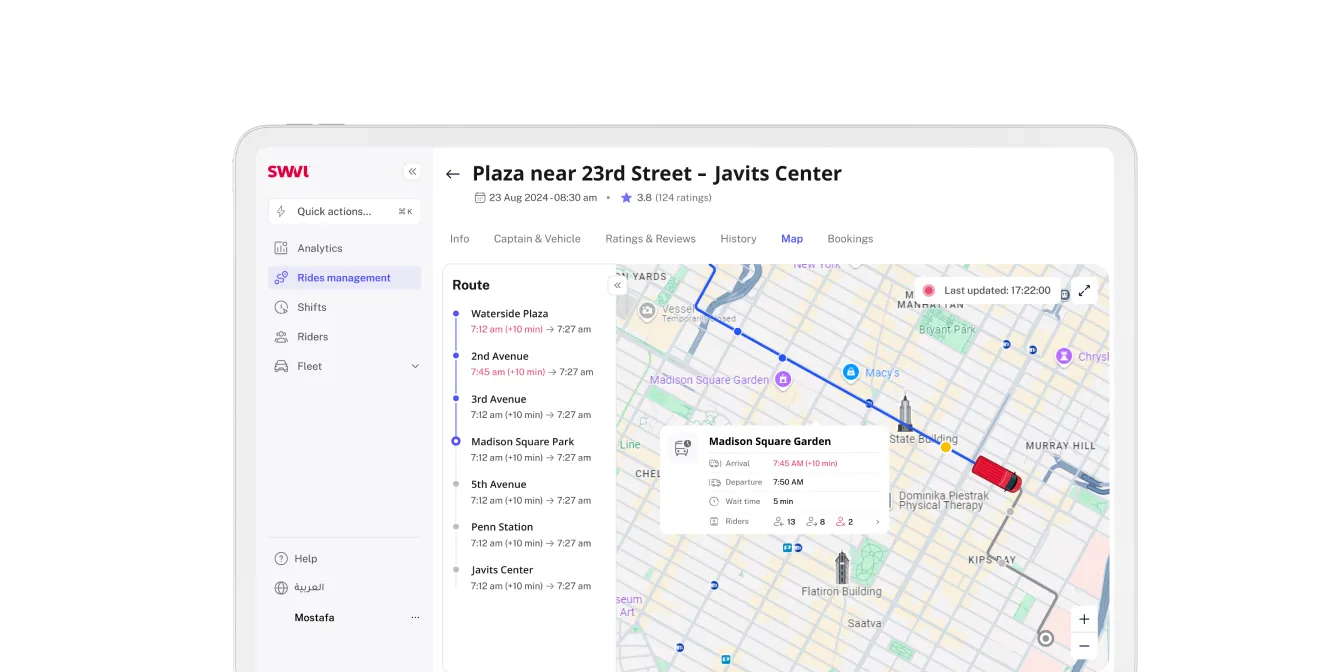
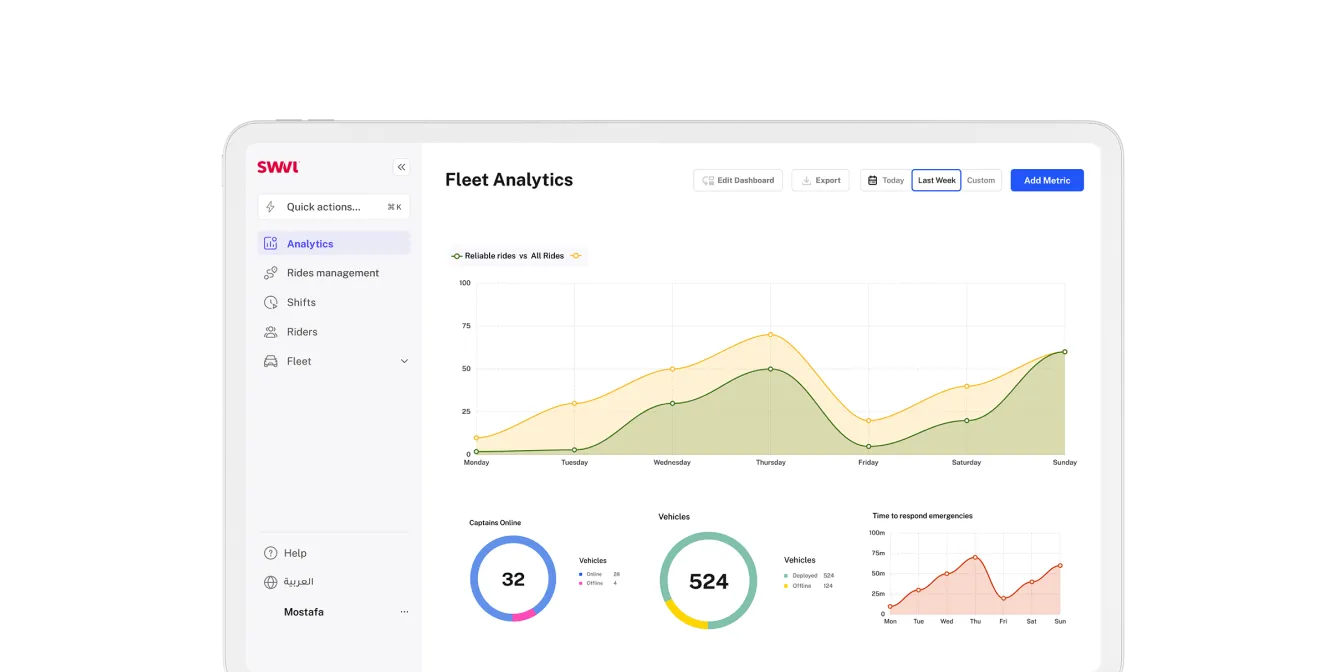
Real-Time Insights
Take data-driven decisions with Swvl’s comprehensive analytics suite. Swvl’s dashboards provide real-time insights into passengers, fleet performance, ride completion rates, and more. Easily export reports and invoices.
Building More Efficient Transit
Worldwide
Since day one, our mission has been to reshape transportation. With over 168 million rides and counting, we're proud of the difference we've made.
See how our innovative solutions continue to transform business transit.
180
Mn
Completed Bookings
390
Mobility Deployment
45
K
Captains & Vehicles
240
Transport Vendors
Office Commute
Transform your team's daily commute with Swvl. Offer the ease of comfortable, timely rides that enhance productivity and ensure your team arrives energized, ready to tackle the day.
See more
School Transit
Ensure your child's safe, reliable school commute with Swvl. Our user-friendly parent portal and strict safety protocols provide peace of mind, ensuring secure, on-time rides you can trust every day.
See more
Factory Transit
Swvl's factory shuttles boost efficiency by ensuring timely arrivals and optimized routes. Cut costs and keep your workforce productive with our dependable transport solutions.
See more
24/7 Shuttles
Transform your team's daily commute with Swvl. Offer the ease of comfortable, timely rides that enhance productivity and ensure your team arrives energized, ready to tackle the day.
See more
Smart Transit
Swvl revolutionizes city transit with eco-friendly solutions and optimized routes. Enhance mobility with reliable, equitable transportation and real-time updates for all residents.
See more
Swvl Product Suite
Customer App
Partner Portal
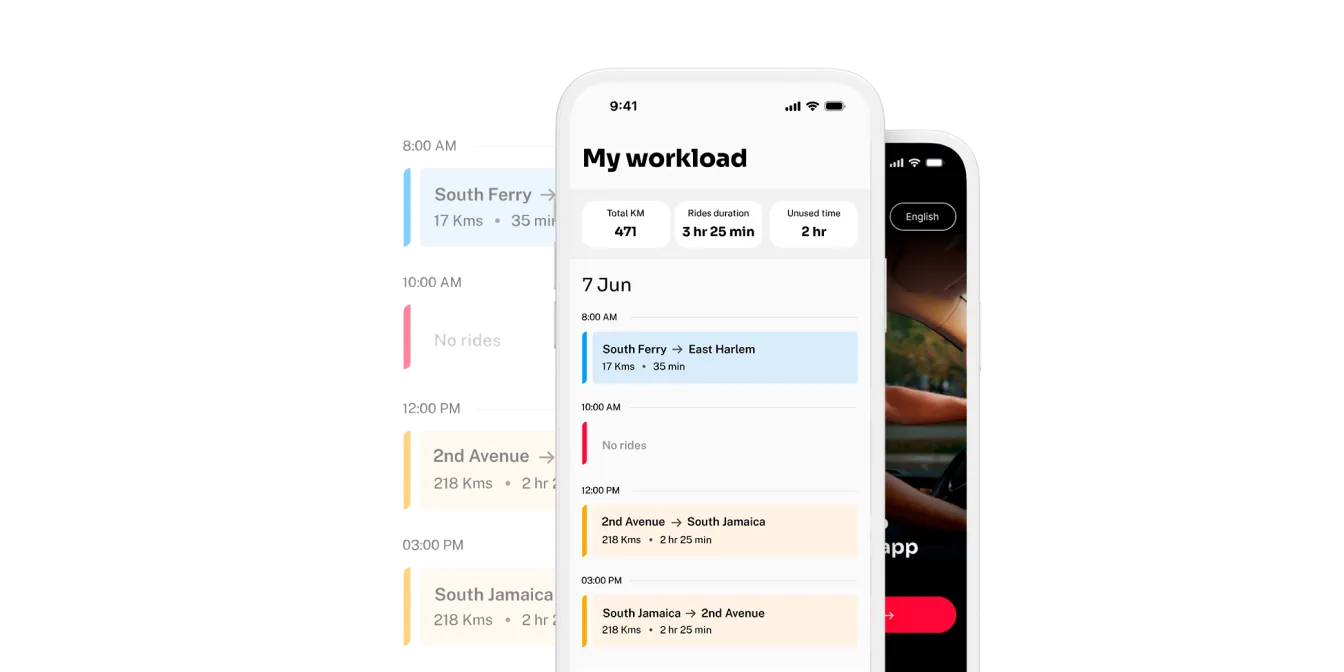
Captain App
Admin Dashboard
Hear From Our Clients
See why companies are switching to Swvl for their employee commutes.